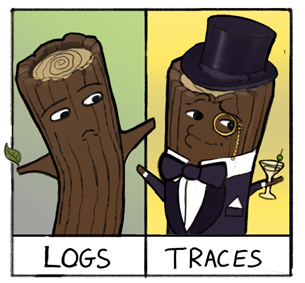
Tracing 101
Opentelemtry and Rust tracing

Traces

-
Unique Trace IDs for 1 user action
- shared across multiple services
Spans
-
Resource Attributes
- shared by spans in a service
-
Span Attributes
- High Cardinality data for each span.
-
Events
- Gives us timing, and details inside the span
Sampling
-
We don't want traces for all events
- That'd be expensive
$$$$$$$$$$
- That'd be expensive
- Sample rate should be representative of out users
Trace Headers
traceparent & tracestate
traceparent: 00-4bf92f3577b34da6a3ce929d0e0e4736-00f067aa0ba902b7-01
             │  │                                │                │
version ◄────┘  │                                │                │
trace-id ◄──────┘                                │                │
parent-id  ◄─────────────────────────────────────┘                │
trace-flags (01 = sampled) ◄──────────────────────────────────────┘

tracestate: key=value,vendorname1=opaqueValue1,vendorname2=opaqueValue2
Rust Tracing
Events
use tracing::{event, info, Level};

// records an event outside of any span context:
event!(Level::INFO, "something happened");

info!(foo=blah, "something else happened")

info!(target:"otel::tracing", "Only exported to tracing")
Spans
use tracing::{span, Level};

let span = span!(Level::info, "my span");
// Enter the span, returning a guard object.
let _enter = span.enter();

let json = info_span!("json.parse").in_scope(||
    serde_json::from_slice(&buf)
)?;
// Any trace events that occur before the guard is
// dropped will occur within the span.

// Dropping the guard will exit the span.
Automatic Instrumentation
#[tracing::instrument]
pub fn my_function(my_arg: usize) {
    // This event will be recorded inside a span named `my_function`
    // with the field `my_arg`.
    info!("inside my_function!");
}
Otel semantic convention
Demo
Lets looks at some dashboards